Table of Contents
- 1. What is ultra wideband radio technology?
- 2. What was the UWB measurement setup?
- 3. What materials were used in measurement?
- 4. How thick was each material?
- 5. How do I get RescueNet UWB measurement data?
- 6. What does data files and header files in query result contain?
1. What is ultra wideband radio technology?
UWB is a wireless radio technology that transmits signals across a much wider frequency at extremely high data rate than conventional systems. The waveforms are so much broadband that they are very difficult to detect. UWB technology is applicable when transmiting data between two devices within short range with severe noise because its short duration waveforms are not cancelled much by multipath effect.
2. What was the UWB measurement setup?
One of the two radios was put on the stool 1m high to avoid multipath from the floor. And the other was enclosed within an insulated wooden box. This box helps prevent multipath signals from arriving at a receiver. Between the radios were placed materials such as a concrete wall and plywood, which were put closer to the insulated wooden box. To get measurement at different distances, we fixed the concrete wall and insulated box and moved the radio on the stool.
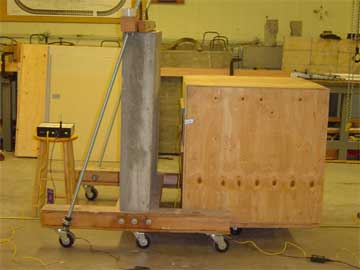
< Lab experiment setup >
3. What materials were used in measurement?
Freespace test was done for a base case. And concrete, reinforced concrete, plywoods, drywall, or combination of those materials were used. Concrete and reinforced concrete were 40(in) wide and 40(in) high, and rebar was placed every 4 inches in reinforced concrete.
4. How thick was each material?
- Concrete: 6.5 in
- Plywood: 0.5 in
- Drywall: 0.5 in
- Reinforced_concrete: 7.5 in
5. How do I get RescueNet UWB measurement data?
You can get our measurment data by querying our rescuenet database from UWB_Database. Choose material type from drop down box, and set material thickness and radio distance you want. You can click "ALL" button on the right side to automatically set the values that includes all the range. Thickness doesn't need to be set when material type is set to "Freespace".
6. What does data files and header files in query result contain?
For each radio distance, five measurements were performed. Those five tests were combined into one file, so each column of data file represents one test. One column can be plotted using matlab to see the shape of the received signal, or to analyze the signal.